
By Megan Sam
After enduring two floods in just over a year, the Cedar Key Water and Sewer District realized it was time to move its administration building to higher ground. To guide that critical decision, they turned to an innovative tool developed by researchers at the University of Florida — the Resilient Cedar Key Dashboard.
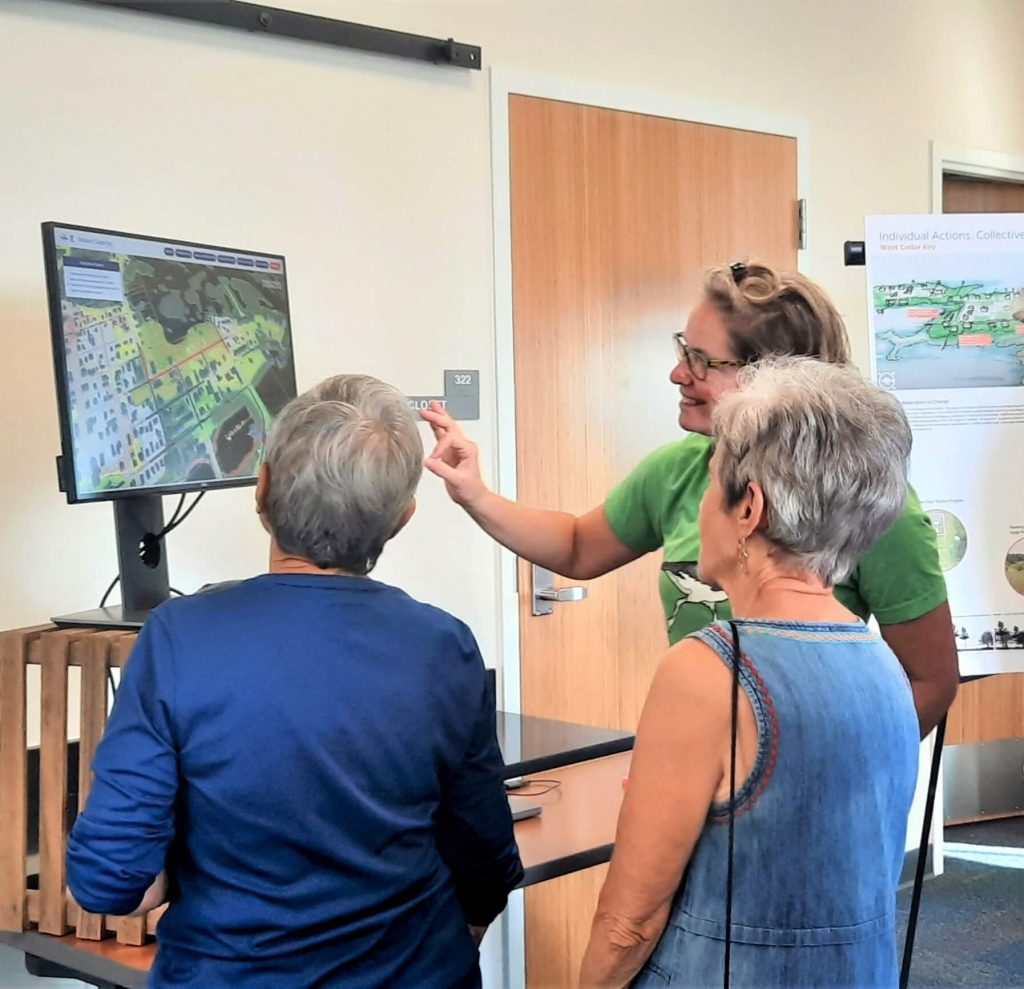
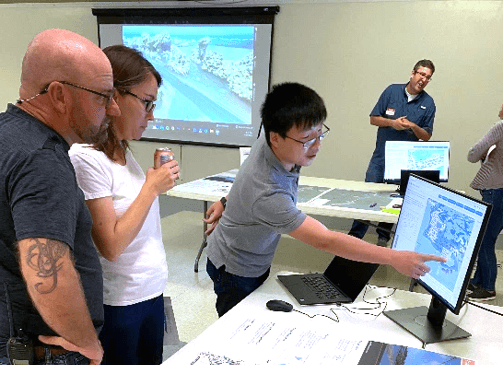
This free, interactive web-based mapping tool lets users explore and visualize flood scenarios in real time — from storm surge depths to projected sea level rise from 2040 to 2070. It’s designed to equip decision-makers, residents and business owners with the data they need to plan and adapt to a changing future.
“The dashboard came in handy for finding a new location for the administration building to prevent flooding during future hurricanes,” said Joe Hand, a member of the Cedar Key Water and Sewer District board of commissioners. “It was the easiest way for me to present my ideas at a board meeting.”
Developed by the Florida Institute for Built Environment Resilience (FIBER), the dashboard is part of the Resilient Cedar Key project, a broader effort to help the town adapt to rising seas and a changing climate. Funded by the Florida Department of Environmental Protection (FDEP), the project also includes a comprehensive flooding vulnerability assessment and an adaptation plan.
At the center of the project is the dashboard, which combines a geospatial dashboard with an urban digital twin — a virtual replica of the built environment — to make complex data easier to visualize, interpret and apply in local decision-making.
“The dashboard acts as a consensus-building platform between researchers and the public,” said Changjie Chen, Ph.D., an assistant scientist at FIBER and the lead developer of the tool. “Traditionally, we present static maps during coastal resilience planning. But this interactive tool allows users to explore their own flood risks. For example, they can see how a future hurricane might impact their boat or home. That kind of personal engagement helps build trust and opens space for dialogue.”
Soon after the dashboard’s debut, Hurricane Idalia hit Cedar Key, providing an unexpected real-world test of its capabilities. The project team used it to deliver highly accurate, location-specific flood projections — within inches of the actual outcomes — and to pinpoint vulnerable critical infrastructure, including the former city hall.
“The city had been debating moving critical infrastructure like city hall and the police station for years,” said Savanna Barry, Ph.D., a regional specialized extension agent at Florida Sea Grant and liaison between UF and the Cedar Key community. “After Idalia, and with clear data from the dashboard, they decided to relocate the building to higher ground. I think city leaders credit the tool as swaying them to finally make that decision. It really brought the data and reality to their decision-making.”
Guided by insights of the tool, Cedar Key has already secured over $1 million in land preservation funding to acquire flood-prone, undeveloped lots, a key step toward reducing future flood risk and building long-term resilience.
Designed to be adaptable, the tool has been customized for other communities; a version based on the Cedar Key model is now in use in Port St. Joe, Florida. The success of this work also sparked a partnership with the UF Center for Coastal Solutions to create JaxTwin, a digital twin of Jacksonville that lets community leaders forecast hurricane impacts, explore future conditions, and evaluate resilience strategies for the city’s residents.
“I’m excited to see this tool, the vulnerability assessment and adaptation plan come to life,” said Barry. “In five to 10 years, we may be able to look back and see that certain roads don’t flood anymore because the city used this data to act. Cedar Key has really sprung into action.”
See the Resilient Cedar Key web app in action: https://resilientcedarkey.web.app/
Related articles: